
「なんだか今月、売上が低い気がする…」
そんなモヤモヤを感じたとき、なんとなくの感覚だけで判断するのではなく、データを使って冷静に状況を把握することが大切です。
この記事では、売上金額が低いと感じたときに、まず“事実”を見える化するためのExcel分析方法をご紹介します。
📌 「これ、自動化できたらラクなのに…」と思ったこと、ありませんか? 👇実務で“そのまま使える”テンプレ付きで、コピペするだけ!
実はその作業、Excelマクロで簡単に自動化できるかもしれません。
「でもマクロって難しそう…」という方のために、完全初心者向けの入門記事をご用意しました!
初心者向けエクセルマクロの作り方を解説|コピペOK実務テンプレ付き

目次
売上金額が低い状況をデータで見える化するための準備
まずは、売上の状況を視覚化できるようにする準備から始めましょう。エクセルで分析するには、元となる売上データが必要です。
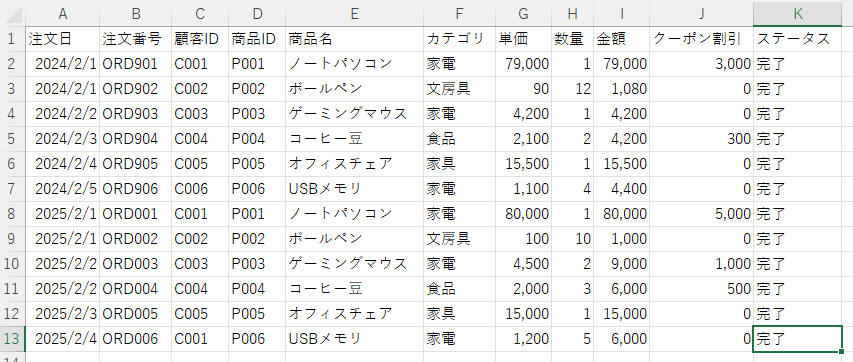
■ 売上データCSVファイルについて
売上データは、たとえば以下のようなCSV形式で出力されていることが多いです。

このようなCSVファイルをExcelに読み込めば、日付ごとの売上推移の売上状況を視覚的に把握できます。
Excel VBAで売上分析を行う方法|フォーム作成から集計・グラフ化まで
次に、実際にどのように分析を進めていくのかを解説します。
1. 準備した売上データCSVをExcelbookに保存
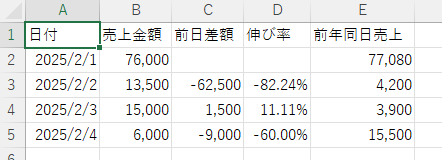
2. Excelbookの売上データを元に必要な項目を集計
3. 売上集計したシートをもとに日別売上推移をグラフ化
たったこれだけで、どの日に売上が低かったのか、逆に高かったのかが一目でわかるようになります。
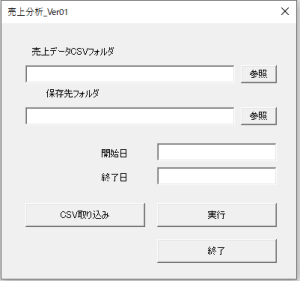
■ フォーム作成手順
■ 売上データから必要項目を自動集計する
■ 集計データを基に日別売上推移をグラフ化する手順
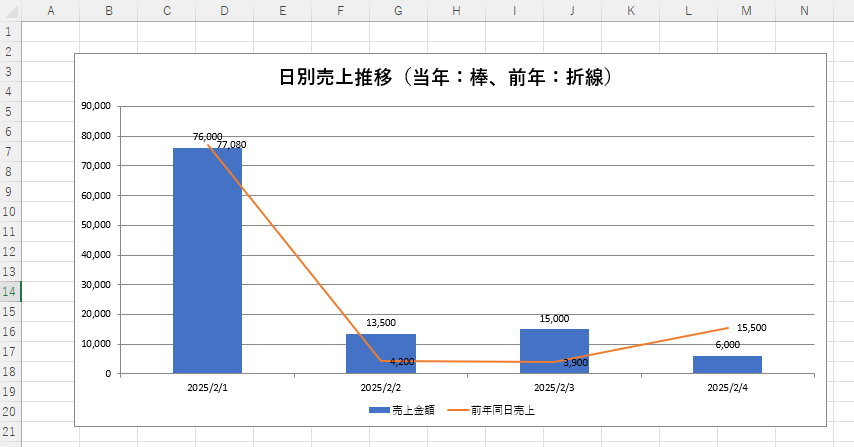
この日別売上推移グラフをチェックすれば、どの日に売上が前年同日より低かったのか、状況がすぐにわかります。
【コピペOK】売上分析に使えるExcel VBAコード
エクセルVBAで自動化したい場合、以下のコードで日別売上の集計グラフを作ることが可能です。
ThisWorkbookモジュール用コード
- Option Explicit
- Private Sub Workbook_Open()
- UserForm1.Show vbModeless ' モーダルエラーを回避
- End Sub
フォームモジュール用コード
- Option Explicit
- Private Sub UserForm_Initialize()
- ' フォーム初期化時にウィンドウを最小化し、フォームを前面に出す
- Application.WindowState = xlMinimized
- Me.Show vbModeless
- End Sub
- Private Sub btnSelectCSVFolder_Click()
- Dim fldr As FileDialog
- Set fldr = Application.FileDialog(msoFileDialogFolderPicker)
- If fldr.Show = -1 Then
- txtCSVFolder.Value = fldr.SelectedItems(1)
- End If
- End Sub
- Private Sub btnSelectOutputFolder_Click()
- Dim fldr As FileDialog
- Set fldr = Application.FileDialog(msoFileDialogFolderPicker)
- If fldr.Show = -1 Then
- txtOutputFolder.Value = fldr.SelectedItems(1)
- End If
- End Sub
- Private Sub btnImportCSV_Click()
- If txtCSVFolder.Value = "" Then
- MsgBox "CSVフォルダを指定してください。", vbExclamation
- Exit Sub
- End If
- If Not IsDate(txtStartDate.Value) Or Not IsDate(txtEndDate.Value) Then
- MsgBox "日付を正しく入力してください。(例:2024/02/01)", vbExclamation
- Exit Sub
- End If
- Dim startDate As Date, endDate As Date
- startDate = CDate(txtStartDate.Value)
- endDate = CDate(txtEndDate.Value)
- If startDate > endDate Then
- MsgBox "開始日は終了日より前にしてください。", vbExclamation
- Exit Sub
- End If
- Call ImportCSVData(txtCSVFolder.Value, startDate, endDate)
- ' フォームを前面に戻す
- Me.Hide
- Application.WindowState = xlMinimized
- Me.Show vbModeless
- End Sub
- Private Sub btnRun_Click()
- If txtOutputFolder.Value = "" Then
- MsgBox "保存先フォルダを指定してください。", vbExclamation
- Exit Sub
- End If
- Dim startDate As Date, endDate As Date
- startDate = CDate(txtStartDate.Value)
- endDate = CDate(txtEndDate.Value)
- Call GenerateReport(txtOutputFolder.Value, startDate, endDate)
- ' フォームを前面に戻す
- Me.Hide
- Application.WindowState = xlMinimized
- Me.Show vbModeless
- End Sub
- Private Sub btnClose_Click()
- ThisWorkbook.Save
- Application.Quit
- End Sub
自分の実力を客観的にチェックしたい…。そんな方のために、自分に合ったスタート地点がわかる無料のExcelVBAベーシック選択問題集をご用意しました。
標準モジュール用コード
- Option Explicit
- Sub ImportCSVData(csvFolder As String, startDate As Date, endDate As Date)
- Application.ScreenUpdating = False
- Application.EnableEvents = False
- Application.DisplayAlerts = False
- Dim fName As String, fullPath As String
- Dim wbCSV As Workbook, wsCSV As Worksheet
- Dim targetWb As Workbook, wsTarget As Worksheet
- Dim lastRow As Long, r As Long, nextRow As Long
- Dim orderDate As Date
- Dim headerWritten As Boolean
- ' 保存用ブックのパス
- Dim savePath As String
- savePath = csvFolder & "\売上集計元データ.xlsx"
- ' 既存 or 新規作成
- On Error Resume Next
- Set targetWb = Workbooks.Open(savePath)
- If targetWb Is Nothing Then
- Set targetWb = Workbooks.Add
- targetWb.SaveAs Filename:=savePath
- End If
- On Error GoTo 0
- ' シート取得
- On Error Resume Next
- Set wsTarget = targetWb.Sheets("元データ")
- If wsTarget Is Nothing Then
- Set wsTarget = targetWb.Sheets(1)
- wsTarget.Name = "元データ"
- End If
- On Error GoTo 0
- ' ヘッダー未設定の場合、1行目にヘッダー追加
- If wsTarget.Cells(1, 1).Value = "" Then
- wsTarget.Range("A1:K1").Value = Array("注文日", "注文番号", "顧客ID", "商品ID", "商品名", "カテゴリ", "単価", "数量", "金額", "クーポン割引", "ステータス")
- End If
- ' 次の行を取得(ヘッダー行の次)
- nextRow = wsTarget.Cells(wsTarget.Rows.Count, 1).End(xlUp).Row + 1
- ' CSV処理
- fName = Dir(csvFolder & "\*.csv")
- Do While fName <> ""
- fullPath = csvFolder & "\" & fName
- Set wbCSV = Workbooks.Open(fullPath)
- Set wsCSV = wbCSV.Sheets(1)
- lastRow = wsCSV.Cells(wsCSV.Rows.Count, 1).End(xlUp).Row
- For r = 2 To lastRow
- If IsDate(wsCSV.Cells(r, 1).Value) Then
- orderDate = CDate(wsCSV.Cells(r, 1).Value)
- If orderDate >= startDate And orderDate <= endDate Then
- wsTarget.Range("A" & nextRow & ":K" & nextRow).Value = wsCSV.Range("A" & r & ":K" & r).Value
- nextRow = nextRow + 1
- End If
- End If
- Next r
- wbCSV.Close SaveChanges:=False
- fName = Dir
- Loop
- wsTarget.Cells.EntireColumn.AutoFit
- ' カンマ編集(単価G列、金額I列、クーポン割引J列)
- With wsTarget
- .Columns("G").NumberFormat = "#,##0"
- .Columns("I").NumberFormat = "#,##0"
- .Columns("J").NumberFormat = "#,##0"
- End With
- targetWb.Save
- targetWb.Close
- MsgBox "CSVの取り込みが完了しました。", vbInformation
- Application.ScreenUpdating = True
- Application.EnableEvents = True
- Application.DisplayAlerts = True
- End Sub
- Sub GenerateReport(outputFolder As String, startDate As Date, endDate As Date)
- Application.ScreenUpdating = False
- Application.EnableEvents = False
- Application.DisplayAlerts = False
- Dim srcWb As Workbook, wsSrc As Worksheet
- Dim salesDict As Object: Set salesDict = CreateObject("Scripting.Dictionary")
- Dim salesDictLastYear As Object: Set salesDictLastYear = CreateObject("Scripting.Dictionary")
- Dim orderDate As Date, amount As Double, discount As Double
- Dim lastRow As Long, r As Long
- ' 元データブックを開く
- Set srcWb = Workbooks.Open(outputFolder & "\売上集計元データ.xlsx")
- Set wsSrc = srcWb.Sheets("元データ")
- lastRow = wsSrc.Cells(wsSrc.Rows.Count, 1).End(xlUp).Row
- For r = 2 To lastRow
- If IsDate(wsSrc.Cells(r, 1)) Then
- orderDate = CDate(wsSrc.Cells(r, 1).Value)
- amount = Val(wsSrc.Cells(r, 9).Value)
- discount = Val(wsSrc.Cells(r, 10).Value)
- If orderDate >= startDate And orderDate <= endDate Then
- If salesDict.exists(orderDate) Then
- salesDict(orderDate) = salesDict(orderDate) + (amount - discount)
- Else
- salesDict.Add orderDate, amount - discount
- End If
- End If
- ' 前年同日
- If orderDate >= DateAdd("yyyy", -1, startDate) And orderDate <= DateAdd("yyyy", -1, endDate) Then
- If salesDictLastYear.exists(orderDate) Then
- salesDictLastYear(orderDate) = salesDictLastYear(orderDate) + (amount - discount)
- Else
- salesDictLastYear.Add orderDate, amount - discount
- End If
- End If
- End If
- Next r
- srcWb.Close SaveChanges:=False
- If salesDict.Count = 0 Then
- MsgBox "売上データが見つかりませんでした。", vbInformation
- Exit Sub
- End If
- ' 新しいブックで集計
- Dim newWb As Workbook: Set newWb = Workbooks.Add
- Dim dest As Worksheet: Set dest = newWb.Sheets(1)
- dest.Name = "売上集計"
- dest.Range("A1:E1").Value = Array("日付", "売上金額", "前日差額", "伸び率", "前年同日売上")
- Dim keys As Variant: keys = salesDict.keys
- Call BubbleSortDates(keys)
- Dim i As Long
- For i = 0 To UBound(keys)
- Dim dt As Date: dt = keys(i)
- dest.Cells(i + 2, 1).Value = dt
- dest.Cells(i + 2, 2).Value = salesDict(dt)
- If i > 0 Then
- Dim prev As Double
- prev = salesDict(keys(i - 1))
- dest.Cells(i + 2, 3).Value = salesDict(dt) - prev
- If prev <> 0 Then
- dest.Cells(i + 2, 4).Value = Format((salesDict(dt) - prev) / prev, "0.00%")
- End If
- End If
- ' 前年同日の値
- Dim lastYearDate As Date: lastYearDate = DateAdd("yyyy", -1, dt)
- If salesDictLastYear.exists(lastYearDate) Then
- dest.Cells(i + 2, 5).Value = salesDictLastYear(lastYearDate)
- Else
- dest.Cells(i + 2, 5).Value = ""
- End If
- Next i
- ' 複合グラフ作成
- dest.Cells.EntireColumn.AutoFit
- ' ========== 複合グラフ作成(列B:売上金額、列G:前年同日売上) ==========
- Dim chObj As ChartObject
- Dim chartSheet As Worksheet
- On Error Resume Next
- Set chartSheet = newWb.Sheets("グラフ日別売上推移")
- On Error GoTo 0
- If chartSheet Is Nothing Then
- Set chartSheet = newWb.Sheets.Add(After:=dest)
- chartSheet.Name = "グラフ日別売上推移"
- Else
- chartSheet.Cells.Clear
- End If
- 'Dim chObj As ChartObject
- Set chObj = chartSheet.ChartObjects.Add(Left:=50, Width:=700, Top:=30, Height:=350)
- With chObj.Chart
- .ChartType = xlColumnClustered
- .HasTitle = True
- .ChartTitle.Text = "日別売上推移(当年:棒、前年:折線)"
- .HasLegend = True
- .Legend.Position = xlLegendPositionBottom
- ' データ系列をすべて削除
- Do While .SeriesCollection.Count > 0
- .SeriesCollection(1).Delete
- Loop
- ' 売上金額(棒グラフ)
- .SeriesCollection.NewSeries
- .SeriesCollection(1).XValues = dest.Range("A2:A" & salesDict.Count + 1)
- .SeriesCollection(1).Values = dest.Range("B2:B" & salesDict.Count + 1)
- .SeriesCollection(1).Name = "売上金額"
- .SeriesCollection(1).ChartType = xlColumnClustered
- .SeriesCollection(1).ApplyDataLabels 'データラベル追加
- ' 前年同日売上(折れ線グラフ)
- .SeriesCollection.NewSeries
- .SeriesCollection(2).XValues = dest.Range("A2:A" & salesDict.Count + 1)
- .SeriesCollection(2).Values = dest.Range("E2:E" & salesDict.Count + 1)
- .SeriesCollection(2).Name = "前年同日売上"
- .SeriesCollection(2).ChartType = xlLine
- .SeriesCollection(2).Format.Line.Weight = 2.25
- .SeriesCollection(2).ApplyDataLabels 'データラベル追加
- End With
- ' カンマ編集(売上金額B列、前日差額C列、前年同日売上E列)
- With dest
- .Columns("B").NumberFormat = "#,##0"
- .Columns("C").NumberFormat = "#,##0"
- .Columns("E").NumberFormat = "#,##0"
- End With
- ' 保存
- Dim savePath As String
- savePath = outputFolder & "\売上集計_" & Format(Now, "yyyymmdd_HHMMSS") & ".xlsx"
- newWb.SaveAs Filename:=savePath
- newWb.Close SaveChanges:=False
- MsgBox "集計ファイルを保存しました。" & vbCrLf & savePath, vbInformation
- Application.ScreenUpdating = True
- Application.EnableEvents = True
- Application.DisplayAlerts = True
- End Sub
- Sub BubbleSortDates(arr As Variant)
- Dim i As Long, j As Long, tmp
- For i = LBound(arr) To UBound(arr) - 1
- For j = i + 1 To UBound(arr)
- If arr(i) > arr(j) Then
- tmp = arr(i)
- arr(i) = arr(j)
- arr(j) = tmp
- End If
- Next j
- Next i
- End Sub
売上金額が低い原因を分析するための次のステップ
売上金額が低いという“状況”が可視化できたら、次に気になるのは、その「原因」。
「売上金額が低い原因が何かを知るエクセル分析のやり方」を、このコードをもとにもっと踏み込んで作成してください。
「Excel VBAで自動化するコードのベースが習得できる解説書」 Excel VBAエキスパートベーシックとスタンダード、どちらを選べばいいか判断が難しい…。そんな方のために、自分に合ったスタート地点がわかる無料のExcelVBAベーシック選択問題集を用意しました。